Data Analytics
Compelling visualizations, uncomfortable insights and pleasing aesthestics. All with a fair dose of tips & tricks, BI best practices and a sprinkling of MSG.
original insightsanimal intuitionscuriosity, nous & data visualization
挑战也是机会
Welcome to this unique blogging experience. Content will mostly focus on data, visual analytics and possibly other things I find interesting (i.e. languages, history, oil & gas). Other topics are best talked about in person, some ideas are just too dangerous for the web. Commentary and advice are provided via thoughtful posts, aiming always for truth and balance. I promise to keep it professional but expect some personality here and there. At times coherent and well laid out. At other times more of a stream of consciousness (or rants).
FAIR WARNING: My sense of humor is not for everyone. No liability shall be assumed whatsoever - user discretion is advised.

Compelling visualizations, uncomfortable insights and pleasing aesthestics. All with a fair dose of tips & tricks, BI best practices and a sprinkling of MSG.
Let's face it: we're both on a journey here. As I gain a deeper understanding on how things work, I will make sure to post cool findings. Eventually my advice may come at price so get it while it's free.
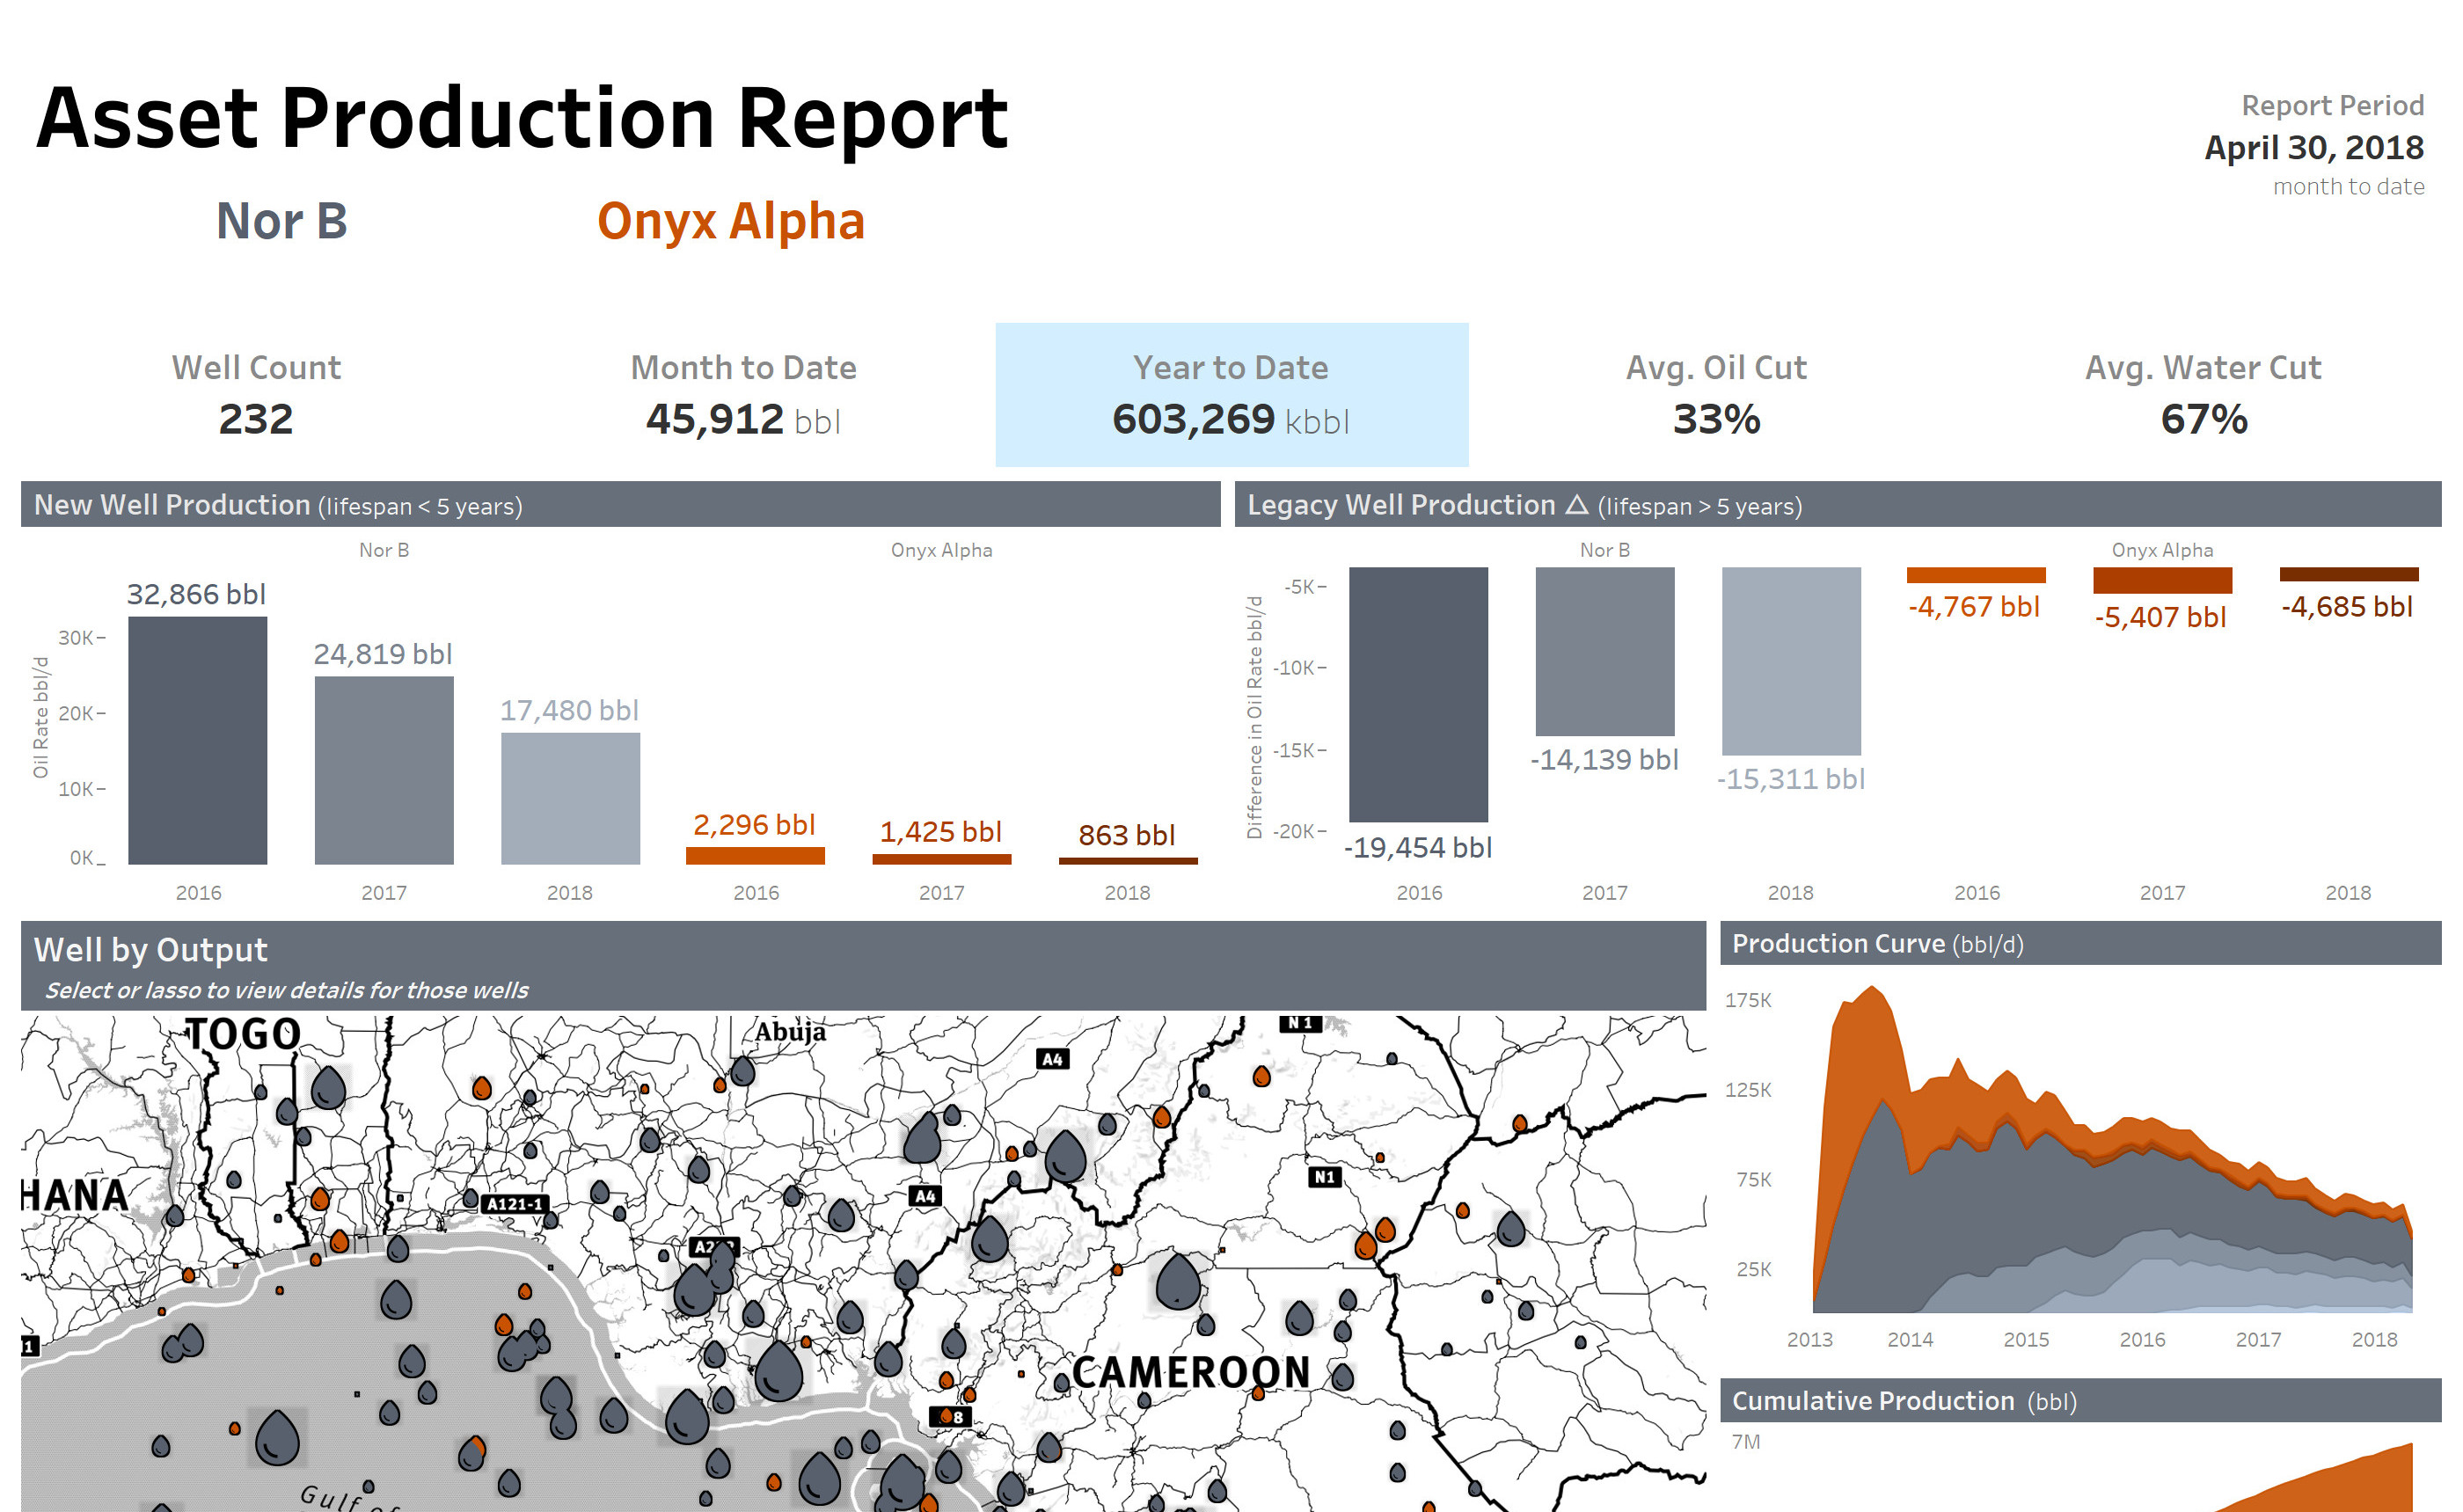
I worked in the industry for 2 and a half years. It is a strong part of my identity and will always remain a subject of interest. The intersection between energy and analytics is a space of great opportunity.
Ok, this coffee mug is supposed to represent any subject that may be categorized as 'other'. Why not be pretentious and call it 'Philosophy' instead? Technologists tend to be pretty esoteric anyways.
Embed Tableau content on your website or application. Use JS functions to extend functionality. A great place to learn these skills from a no-nonsense author.
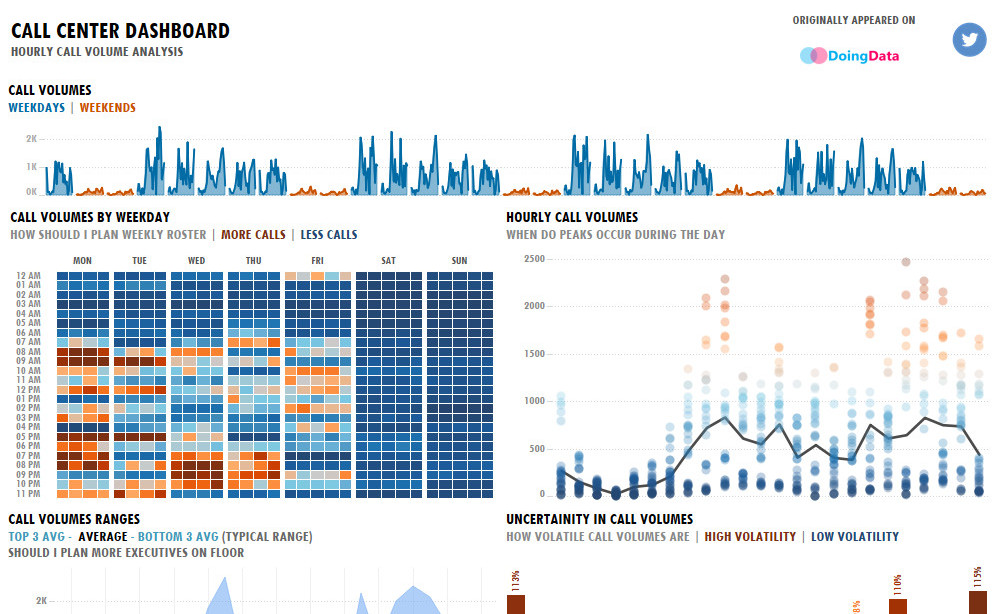
Tableau Public is a treasure trove of fantastic content. Given it's open nature and size sometimes a little guidance is needed. Here you will find a curated collection of my favorite data visualizations.
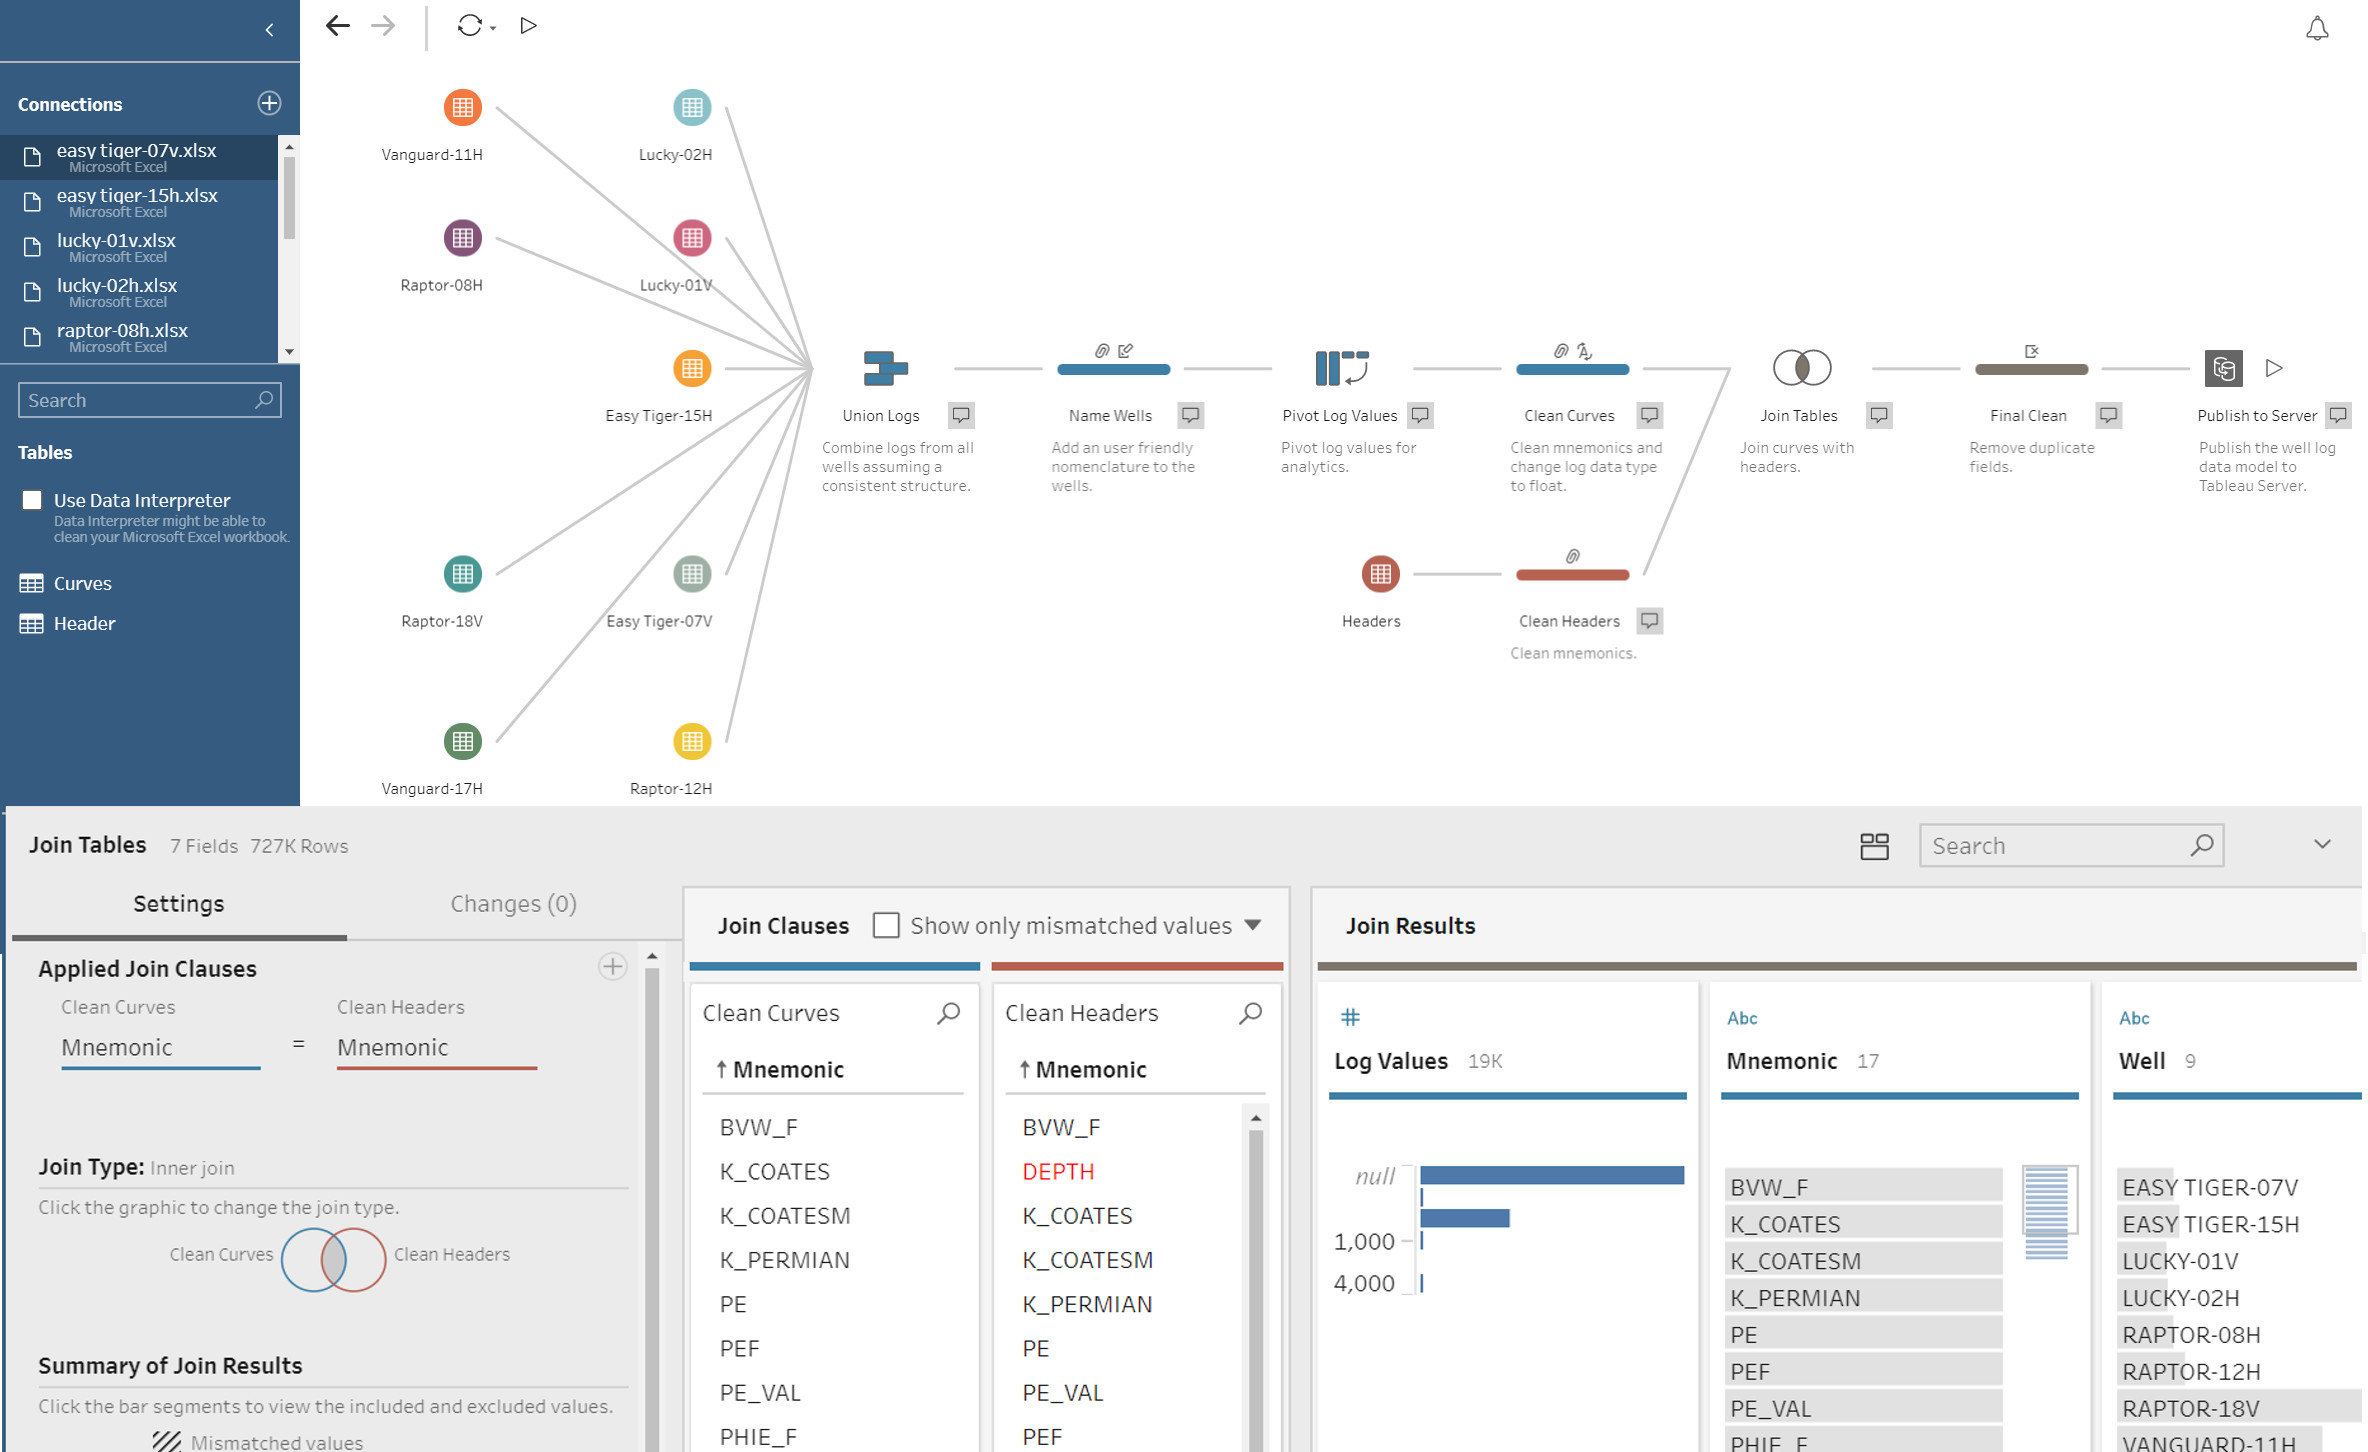
Transform your .las files into a friendlier format. Use Tableau Prep to create a repository of all your logs, create visual magic with Tableau Desktop.


Context. Very important!
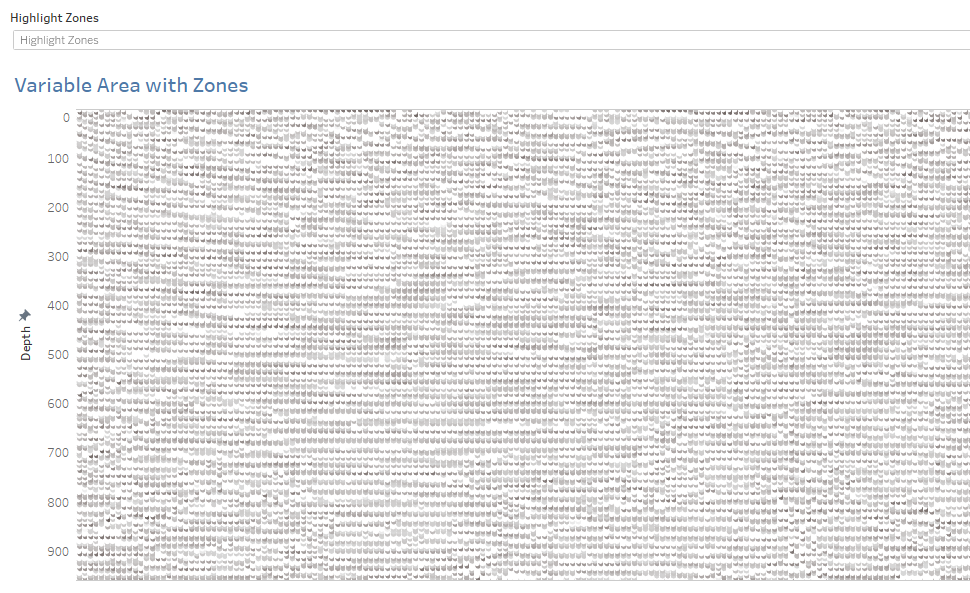
How to visualize seismic reports for oil & gas applications using Tableau. Not your everyday use case but man is the solution pretty cool!
Tableau's JavaScript APIEmbed Tableau content on your website or application. Use JS functions to extend functionality. A great place to learn these skills from a no-nonsense author.
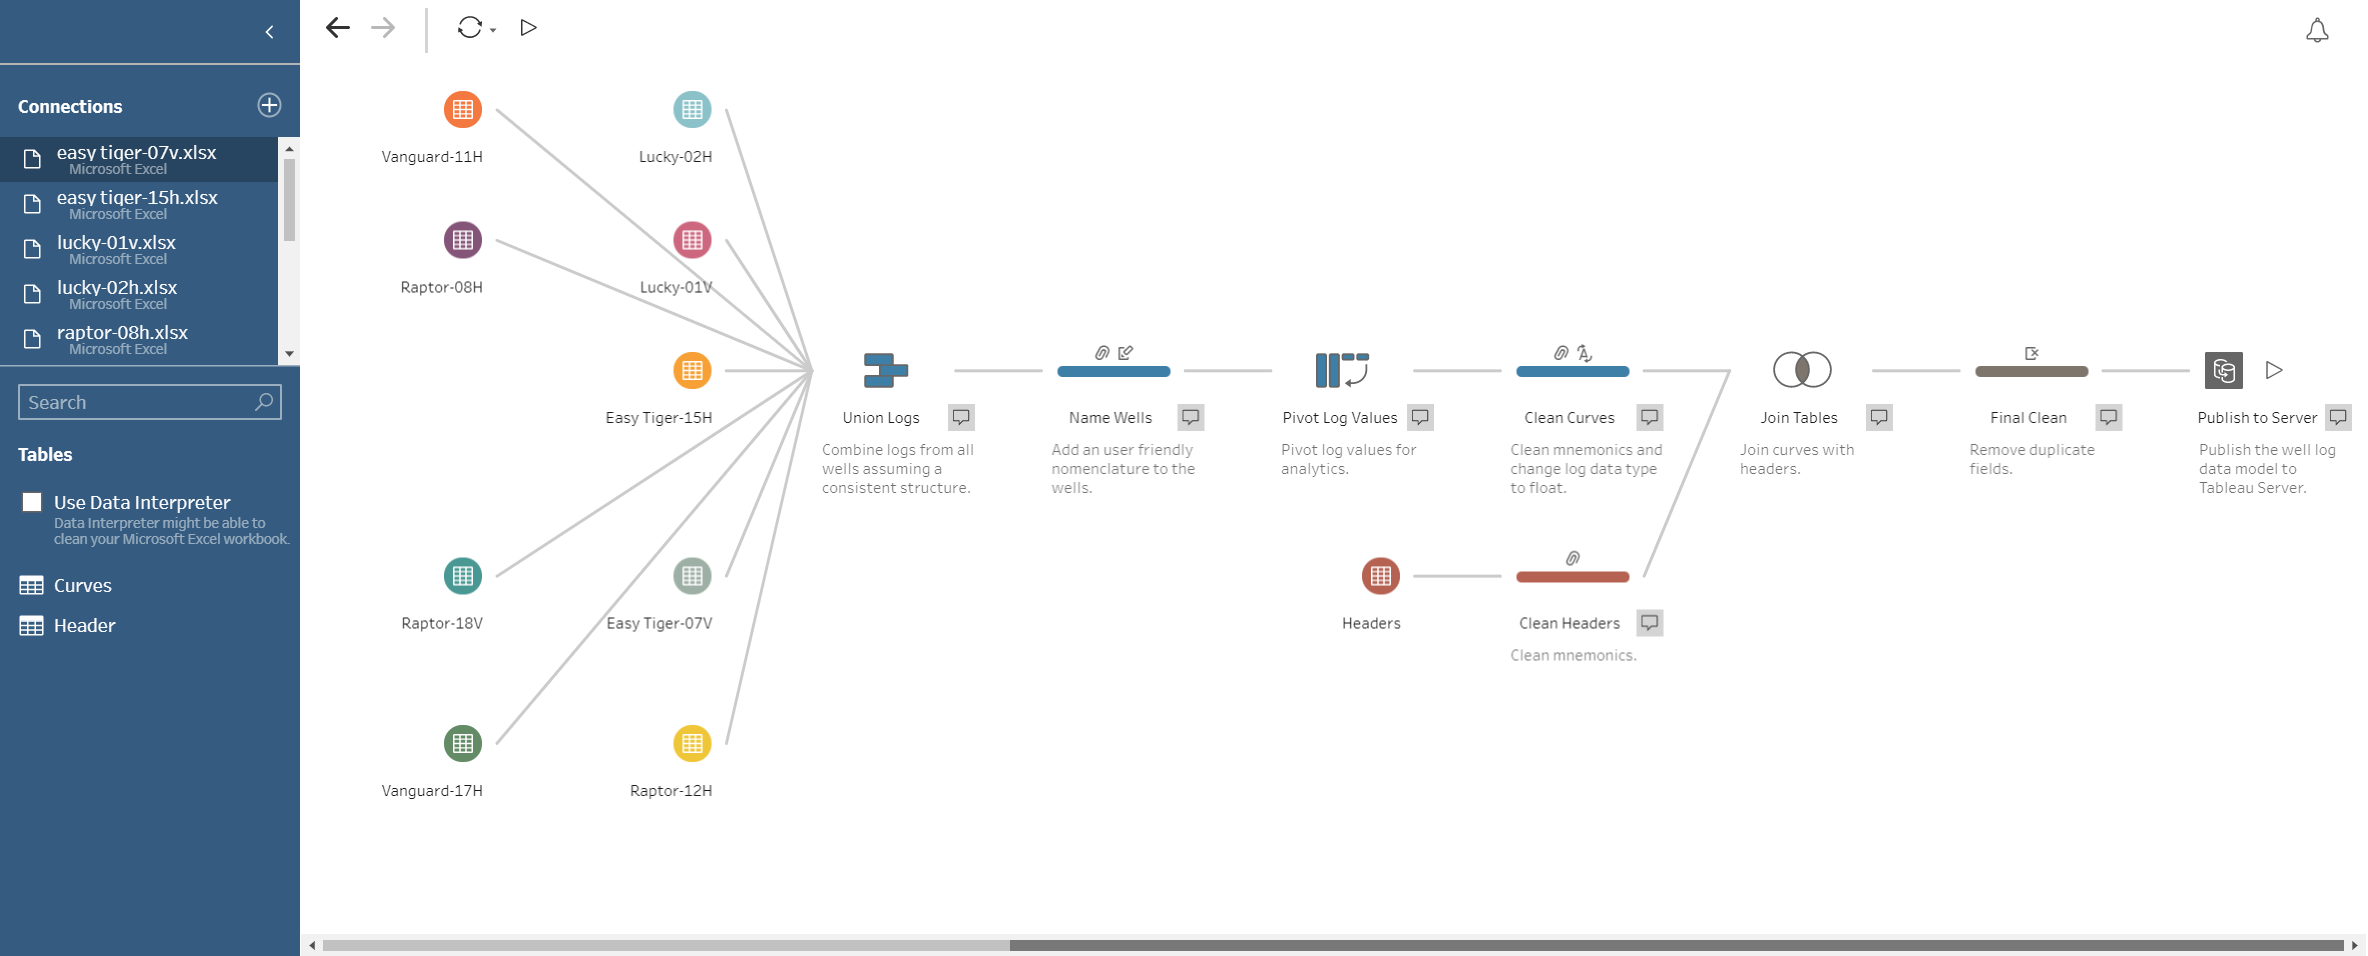
Tableau Well LogsTransform your .las files into a friendlier format. Use Tableau Prep to create a repository of all your logs and let visual magic happen in Tableau Desktop.
Tableau Visual GalleryTableau Public is a treasure trove of fantastic content. Given it's open nature and size sometimes a little guidance is needed. Here you will find a curated collection of my favorite data visualizations.
Reach out to me via email. Feedback is always welcome and I appreciate you visiting my site.