Touching is Allowed
Go ahead and interact with the visualization. Move your phone around and test the layouts. Clicking or touching marks on a graph will perform actions across the dashboard. By selecting marks a nicely formatted HTML table will display at the bottom of the viz.
Navigation
Selected Mark Details
To display a table: touch or click the sheet or visualization and then select the desired marks.
A Brief Introduction
Lately everyone is talking about a thing called "Analytics Ubiquity", referring to the delivery of analytics to consumers by embedding data visualizations into every day products and applications. Ok, not everyone is talking about this (maybe not as often as you may hear about the Kardashians), but in my line of work it definitely is a term that comes up.
If you think about it for a bit, it makes a lot of sense. Here we are surfing this huge wave known as the digital revolution with vast amounts of valuable data being generated with each purchase, with every interaction and impression. Naturally it follows that organizations will seek to monetize this asset or provide an added value to their customers. For example people may want insight into their shopping patterns or they may want to quantify a return on marketing investments they have done with your platform. Maybe your company already provides data to its clients but the delivery seems outdated and static. You may lose control over this valuable commodity by distributing it via flat files. If that is the case surely you are already hearing complaints about how you need to modernize your business - the competition already does it!
There are plenty of use cases that can be very well served by embedding a data analytics platform like Tableau into your existing applications. Not only will you leverage best in class visual analytics and governance but you can also use our JavaScript and REST APIs to seamlessly integrate Tableau into your product. Keep in mind that creating analytics content in Tableau is an enjoyable breeze compared to scripting and it is a skill that is much more straightforward to acquire. I hear developers say they prefer to author analytics content in Tableau due to the speed of iteration, flexibility and ease of use. When you embed Tableau into your application you will also be provided with a governed backend for data security that you do not need to build yourself, where it is easy for content creators to publish their work.
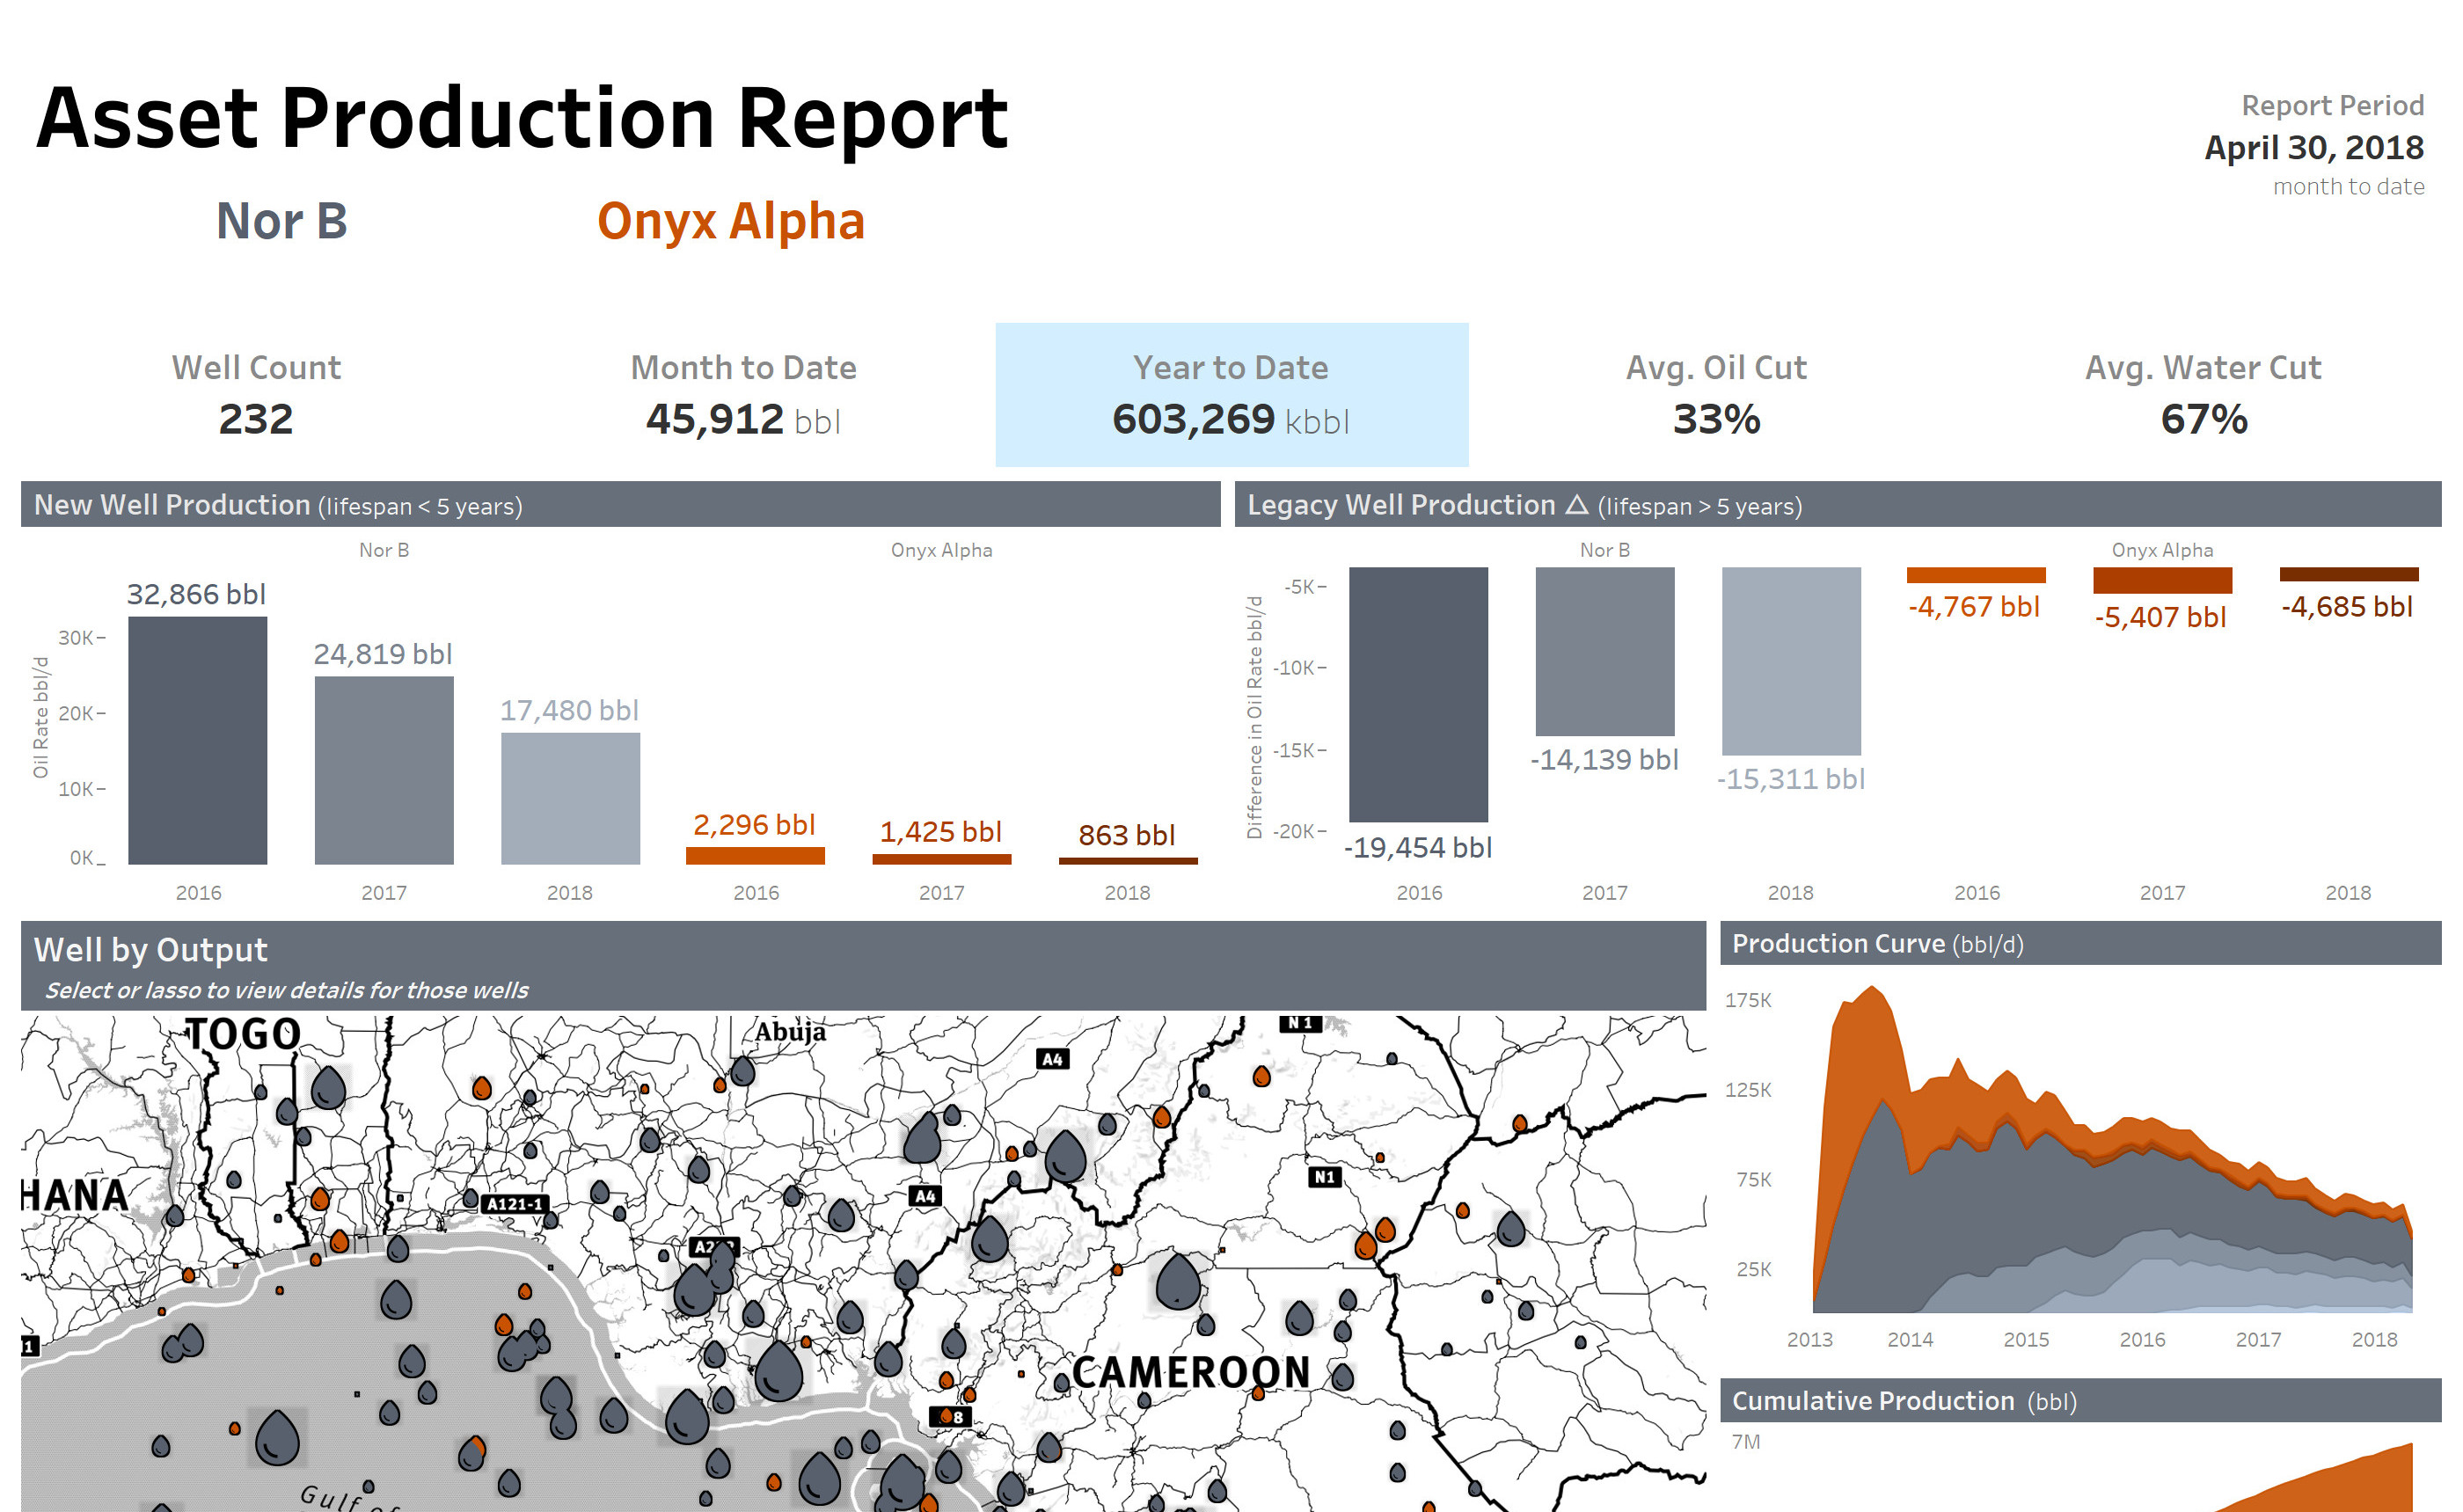
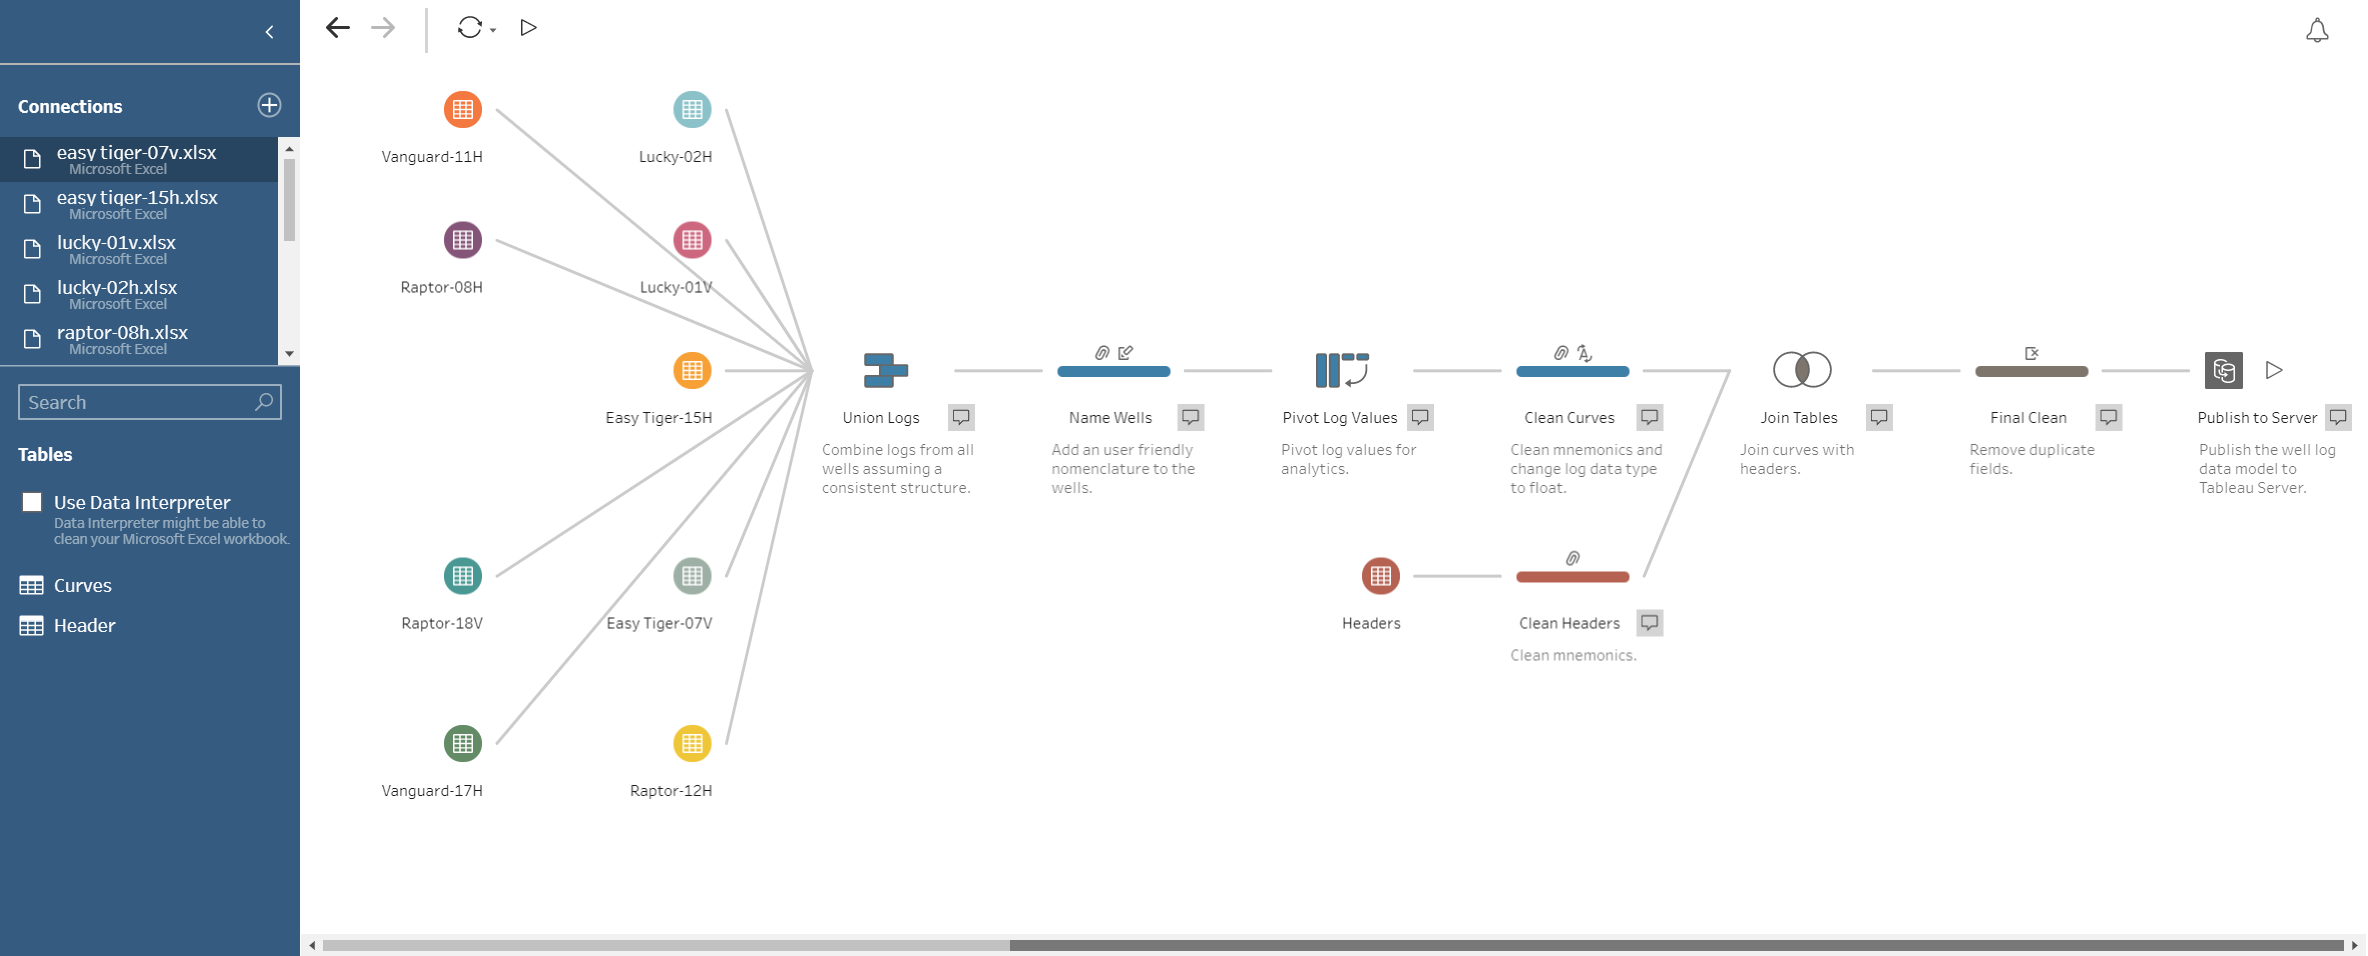
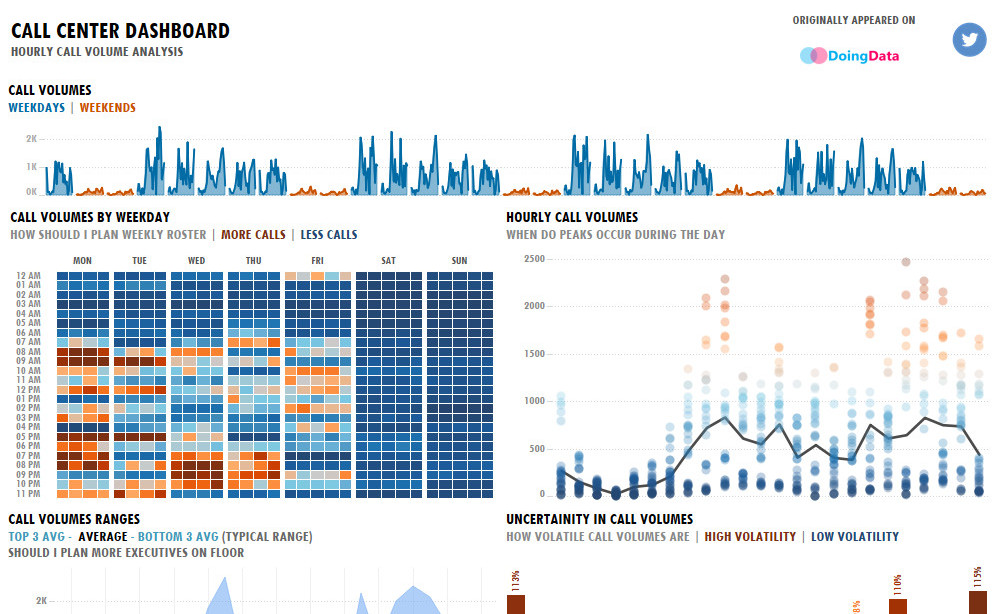
The focus of this post is to present an embedded visualization that will demonstrate functions available in the JS API and also describe how to get started with your own embedded project. All of the data visualizations you see here were made in Tableau Desktop within a 'mobile-first' design plan as most things on the internet these days should be.
Walkthrough
You may have noticed a nice control bar at the top of the visualization. It contains buttons for navigation, exporting of reports and datasets as well as for sharing. These buttons work by calling on Tableau JavaScript API methods and provide prebuilt dialog windows that are very convenient to deploy. In fact they are the same windows found in the native Tableau Server UI. Users can also select multiple marks on a sheet to display a nicely formatted table under Selected Mark Details which is enabled by adding an Event Listener. This set of functionalities is a great place to start learning about the JS API. Essentially what this page is doing is it combines several of the JavaScript samples available on GitHub and does so aesthetically. To help you get started with your own embedded project I will break down each of these methods and explain how they work in detail.
Note: styling is not provided so the appearance of your document will be different.
Initializing the API
First of all you need to embed a visualization on your document. That means that you start by accessing and initializing the JavaScript API. The example you see on this page allows for navigation between different dashboards so it is a bit more complex than embedding a single viz. If you are interested in knowing how that works you can refer to the Basic Embed example. Anyways the methodology is the same. The difference is that in this case you will specify an array of URLs that target each dashboard and loop through them using the next and previous navigation buttons. I assume that you will get acquainted with the accessing and initializing links I provided above before looking at the explanations I have below.
In order to initialize a viz as seen on this page this is what the JavaScript looks like:
<script type="text/javascript" src="YOUR-SERVER/javascripts/api/tableau-2.min.js"></script>
<script type="text/javascript">

var vizList = ["https://YOUR-SERVER/views/YOUR-VISUALIZATION1",
               "https://YOUR-SERVER/views/YOUR-VISUALIZATION2",
               "https://YOUR-SERVER/views/YOUR-VISUALIZATION3"];
// Array of Tableau Server URLs for dashboard or sheet navigation.

var viz,
vizLen = vizList.length,
vizCount = 0;
// Declaration of variables.

function launchViz(vizNav) {
// JS object targeting a div in the html document.
// (vizNav) will pass navigation values to move back and forth across vizList using HTML buttons.
	var vizDiv = document.getElementById("vizContainer"),
	// Will embed the visualization on a div with id="vizContainer"
	options = {
		device: 'desktop',
		hideTabs: true,
		hideToolbar: true,
		onFirstInteractive: function () {
        	listenToMarksSelection();
        }
    };
    // Option parameters that configure how the viz is displayed. Listeners are initialized once viz is interactive.

    vizCount = vizCount + vizNav;
    // +/- 1 added to vizCount as set by navigation buttons via vizNav.

    if (vizCount >= vizLen) {
        vizCount = 0;
    // If vizCount exceeds the length of the array then return to index 0 (displays the first viz).
    } else if (vizCount < 0) {
        vizCount = vizLen - 1;
    // If vizCount is below 0 then return array max index (displays the last viz).
    }

    if (viz) {
        viz.dispose();
    // If a previous viz object exists, delete it.
    }

    var vizURL = vizList[vizCount];
    // Dynamic URL returning the string from vizList at index = vizCount (viz to be displayed).

    viz = new tableau.Viz(vizDiv, vizURL, options);
    // Initializes the viz from the array with desired options.
}
</script>
The notes makes the launchViz(); function pretty self explanatory but the jist of it is that you store an array of Tableau Server URLs in vizList and then use vizCount to navigate through vizLen. They will provide the correct parameters to the new tableau.Viz(); object that will initialize the API and use vizDiv to target a div with id="vizContainer". Users will click on navigation buttons that will call on the function with launchViz(1); for next or launchViz(-1); for previous via vizNav, which will then change the vizCount that is used to obtain the index within the array. It is also necessary to include viz.dispose(); so that an old viz can be removed and be replaced with a new vizualization as the user moves back and forth. If this is not added then you will get an exception.
The vizualization will be embedded on a div with id="vizContainer". Also don't forget to run onload="launchViz(0);" at some point in your document to request the first viz in the array from the Tableau Server that is hosting it. The buttons will then call on the launchViz() function for navigation:
<body onload="launchViz(0);">
	<!-- Tableau Embedded Viz -->
	<div id="vizContainer"></div>

	<!-- Buttons -->
	<button onclick="javascript:launchViz(-1);">Prev</button>
	<button onclick="javascript:launchViz(1);">Next</button>
</body>
Export and Share Methods
The JS API Reference details the classes and methods that are available. Under the Viz Class you can find the methods used below. Honestly this is super simple. You create functions that prefix methods as in viz.method(); to execute the functionality. In this case they will all display a native dialog window to perform actions. These examples can export the entire dashboard as a PDF file or as an image. They can also output the data rows belonging to the sheet the user has selected or generate a crosstab of that sheet for export. The last example displays a share window to obtain a URL or embed code that will reference this visualization.
The JavaScript looks this way:
function exportToPDF() {
	viz.showExportPDFDialog();
// Displays the native export to PDF dialog window.
}

function exportToImage() {
	viz.showExportImageDialog();
// Displays the native export image dialog window.
}

function exportData() {
	viz.showExportDataDialog();
// Displays the native export data dialog window.
}

function exportCrossTab() {
	viz.showExportCrossTabDialog();
// Displays the native export crosstab dialog window.
}

function shareViz() {
	viz.showShareDialog();
// Displays the native share dialog window.
}
The buttons will call on each function and look like this:
<body onload="launchViz(0);">
	<div id="vizContainer"></div>

	<h4>Export Report</h4>
	<ul>
		<li><button onclick="exportToPDF();">PDF</button></li>
		<li><button onclick="exportToImage();">Image</button></li>
	</ul>

	<h4>Export Data</h4>
	<ul>
		<li><button onclick="exportData();">Data</button></li>
		<li><button onclick="exportCrossTab();">XTab</button></li>
	</ul>

	<h4>Share</h4>
	<ul>
		<li><button onclick="shareViz();">Viz</button></li>
	</ul>
</body>
Mark Selection
This functionality allows users to interact with a visualization and in this particular example it will store marks that have been selected so that they can be displayed in a table. This is accomplished by using an event listener that will react to user selected data points or marks. Marks refer to individual visual elements displayed on a sheet. They can be many things such as bars on a bar graph, connected dots on a line graph or slices of a pie! I then display this data in an HTML table for a nice looking result. There are many use cases for event listeners to extend custom functionality to your content. I do want you to keep in mind that this functionality as displayed in this example is very easy to build in a Tableau visualization natively through crosstabs and filters, however the ability to do this in JavaScript can service a more specific need in your application. Maybe you want to format a table that will output JSON for example. In other words once you start embedding Tableau content into your application it is a good practice to know what is easier to do in Tableau itself before writing unnecessary markup. Personally I really liked this exercise so any ways here it goes.
Event Listener
The first step to get this to work is to add an event listener grouped under Events in the very useful Viz Class described in the JS API Reference. This event requires a Tableau Event Name and a function that will occur once executed using this format addEventListener(type: TableauEventName, listener: Function). Within Viz Event Classes you will find TableauEventName Enum that defines the strings used to specify the type of event. In this case I used a fully qualified enum of (marksselection) which is raised when marks are selected or unselected. Finally once marks are acted upon, the listener calls on the onMarksSelection(); function to be described next.
function listenToMarksSelection() {
viz.addEventListener(tableau.TableauEventName.MARKS_SELECTION, onMarksSelection);
}
// Adds an event listener on the loaded viz and calls on the onMarksSelection function with selected marks.
Get Mark Data
Considering the previous function, the MARKS_SELECTION event passes an Event Class on callback called (marksEvent) identifying the marks. This executes the following function that will get the data associated with the selected marks. It does so by using the getMarksAsync() asynchronous method found under the MarksEvent Class that returns a Promise<Mark[]> or an array of marks. Finally the function will also execute the reportSelectedMarks() function.
function onMarksSelection(marksEvent) {
return marksEvent.getMarksAsync().then(reportSelectedMarks);
}
// marksEvent raised by MARKS_SELECTION calls on method getMarksAsync() to get marks then calls on reportSelectedMarks function.
Display the Table
This is where my code deviates from the Respond to Events sample. In the sample selected marks will be displayed as formatted text. I wanted to show them in a neat table so I modified the resulting inner HTML and the loops. Before explaining the JavaScript I want to start by showing how an HTML table is structured. The goal is to create a header row only once but then add new rows for each selected mark displaying the corresponding data values. Since marks will be selected from the same sheet they will have consistent fieldnames and values.
<table>
  <tr>
    <th>Header a</th>
    <th>Header b</th>
    <th>Header c</th>
  </tr>
  <tr>
    <td>Value a1</td>
    <td>Value b1</td>
    <td>Value c1</td>
  </tr>
  <tr>
    <td>Value a2</td>
    <td>Value b2</td>
    <td>Value c2</td>
  </tr>
</table>
The reportSelectedMarks(marks) function works by having seperate variables for table headers and rows. It loops through the marks array and uses the getPairs() property from the Marks Class to obtain the field name and value pairs for each mark. Since I only need to display headers once I added conditions that will create HTML for only the first selected mark at index 0. Given that marks come from the same sheet I assume a consistent structure. It starts by creating a header called "Mark" and then writes the index of each mark as row values under that header. This identifies each individual mark.
As it loops through the marks array the function loops through the corresponding pair values -i.e. each data point associated with that mark containing a fieldname and value, and stores them under the pairs variable. In a similar fashion it writes a single header entry from the first mark using pair.fieldName and then writes the corresponding rows of data using pair.formattedValue. The inner HTML that is generated contains the necessary tags to structure a table. Finally it inserts this HTML into the right header or data tags according to their declared id (markHeaders and markValues).
function reportSelectedMarks(marks) {
// Inserts mark and pair values into tabular format via inner html at appropriate div. One row = a distinct mark.
	var htmlHeaders = "";
	var htmlRows = "";
	// Different logic for table headers and rows to be inserted in a table via inner html.

    for (var markIndex = 0; markIndex < marks.length; markIndex++) {
        var pairs = marks[markIndex].getPairs();
        // Loop through each selected mark and get data pairs (name and value).

        if (markIndex == 0){
    	htmlHeaders += "<tr><th>Mark</th>";
    	}
    	// Mark header only needed once not multiple times.

        htmlRows += "<tr>" + "<td>" + markIndex + "</td>";
        // Mark number used to define each row, so each mark is stored.

        for (var pairIndex = 0; pairIndex < pairs.length; pairIndex++) {
            var pair = pairs[pairIndex];
        // Loop through each pair to store field name and value.

            if (markIndex == 0) {
            	htmlHeaders += "<th>" + pair.fieldName + "</th>";
            // Headers only needed once assuming a consistent structure across marks on the same sheet.
            }

            htmlRows += "<td>" + pair.formattedValue + "</td>";
            // Each value is stored within the corresponding mark/row and header.
        }

        htmlHeaders += "</tr>";
        htmlRows += "</tr>";
        // Close the table row div once loop sequence is complete.
    }

    var infoDiv = document.getElementById('markHeaders');
    infoDiv.innerHTML = htmlHeaders;
    // Insert table header html into markHeaders div.

    var infoDiv = document.getElementById('markValues');
    infoDiv.innerHTML = htmlRows;
    // Insert table row value html into markValues div.
}
The HTML for the empty table is quite simple. It is empty except for the table header and body tags inside of which the appropriate HTML will be written according to their id when the user selects some marks. If no marks are selected then nothing is displayed.
<h3>Selected Mark Details</h3>
<table>
	<thead id="markHeaders">
	</thead>
	<tbody id="markValues">
	</tbody>
</table>
Conclusion
I hope this embedded example and walkthrough help you get started on your own project. You will find that the Tableau platform is a fantastic way to visualize and explore data. Meaning that not only will it help your team create content for your application but it will also provide the right tools to make sense out of this information, adding a tremendous value to the entire process. I provided useful links multiple times throughout this post and I suggest that you also check them out.
If you are interested in adding Tableau into your application or servicing analytics to your customers I suggest that you visit the Embedded Analytics page and use the contact form to talk to someone that can help you get started.